Just like the offense and defense puts scouting reports together to hand out on a weekly basis to the players, we put together a Special Teams Scouting Report. The scouting report will consist of the opponent’s personnel, statistics and a breakdown of each special team (punt, punt return, kickoff, kickoff return, extra point/field goal and extra point/field goal block).
Our preparation for an opponent will begin the week before we play. We do a three-game exchange in our conference with the first two games usually exchanged by Wednesday the week before we play a specific opponent. Once the games are edited, we will have six tapes, one tape for each special team to start our breakdowns. As we break down each tape, we have a form for each special team unit that we fill out.
OPPONENT’S PUNT TEAM
The first special team that we look at is our opponent’s punt team. Diagram 1 shows the form that we use in breaking down their punt team. At the top of the form, we will draw in the formation that they use. At the bottom of the form are questions we want answered about their punt team.
Key points of emphasis –
• Who is the punter and his jersey number?
• Where is the punter’s alignment from the LOS?
• How many steps does he take?
• What is the average snap time?
• What is the get off time - the time it takes for the punter to punt the ball?
• What is the hang time?
• What is our block point?
• What is the punter’s average distance?
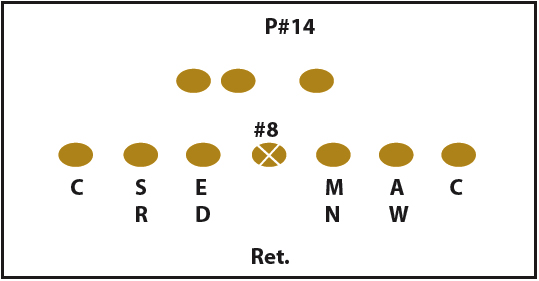
Diagram 1: Scouting the Punt Team
1. System analysis
2. Protection
3. Block Point
4. Observations
5. Snapper
6. Punter – A. Alignment
B. Right/left footed
C. Approach
D. Steps
E. Get off time
7. Coverage – A. Hit men
B. Speed
C. Convergence
D. Overall Quality
8. Net Punt Average
9. Any punts blocked?
The final piece in scouting the punt team is a kicking chart. Diagrams 2 and 2A show how we chart every kick from the LOS to where the ball is caught or lands.
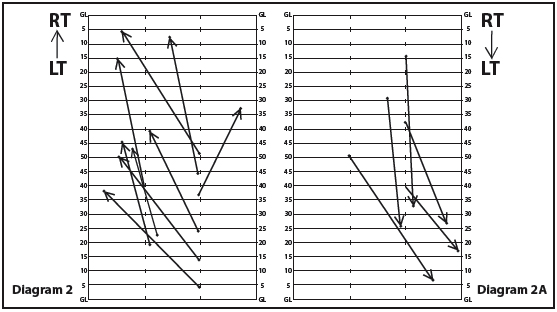
Diagram 2 and 2A: Kicking Chart
This allows us to evaluate the direction the ball comes off the punter’s foot. This chart is really valuable if you don’t have an end zone film exchange.
OPPONENT’S PUNT RETURN (BLOCK) TEAM
Diagram 3 shows you the form used. At the top of the form, we will draw in our punt formation then draw in how they will line up to it. You have more than one chart if your opponent is giving you more than one look.
Key points of emphasis –
• Who is their top returner and his jersey number?
• What kind of returns do they use?
• How do they attack your formation to try to block the punt?
• Do they use certain players as the block guys?
• What are the returner’s statistics?
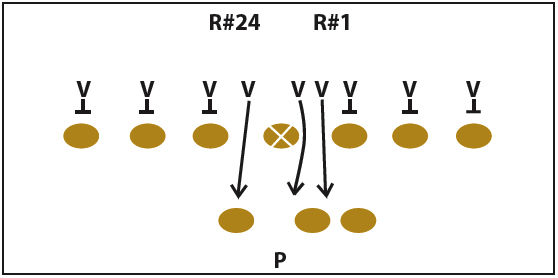
Diagram 3: Scouting – Punt Return/Block Team
I. System analysis
A. Returns
B. Blocks – where? When?
2. Statistics
3. Returners
A. Alignment
B. Acceleration
C. Speed
4. Key observations
5. Do they mass substitute?
OPPONENT’S KICKOFF TEAM
Diagram 4 shows the form we use. At the top of the form, we will draw in where the kicker kicks the ball from - hash or middle - and then we fill in the rest of the kickoff team by their alignment.
Key points of emphasis –
• Who is the kicker and his jersey number?
• What is the kicker’s hang time?
• What is the kicker’s average distance?
• Who are their best cover guys?
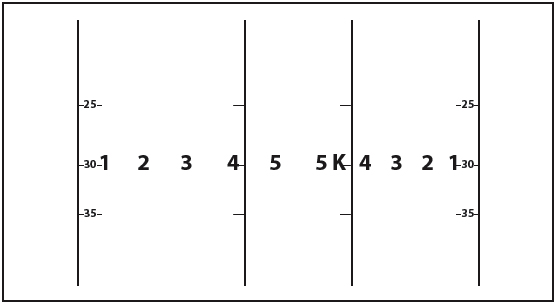
Diagram 4: Scouting – Kickoff Coverage Team
1. System analysis
2. Coverage
3. Best cover men
4. Safeties
5. Average return vs. them
6. Kicker
A. Approach
B. Direction
C. Hang time
7. Key observations
8. Onside kicks
A. When
B. Where
C. Alignment change
Just like we chart all the punter’s kicks, we will chart all of the kicker’s kicks. See Diagram 5 and 5A.
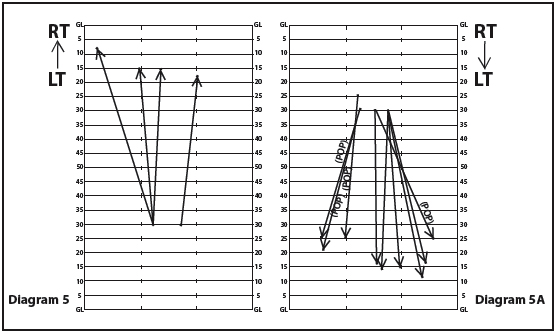
Diagram 5 and 5A: Kicking Chart
OPPONENT’S KICKOFF RETURN TEAM
Diagram 6 shows the form we use. At the top of the form, we will draw in their top returner. As with the punt return page, we may have to include other returners if more than one is used.
Key points of emphasis –
• Who is the top returner(s)?
• What is their average return?
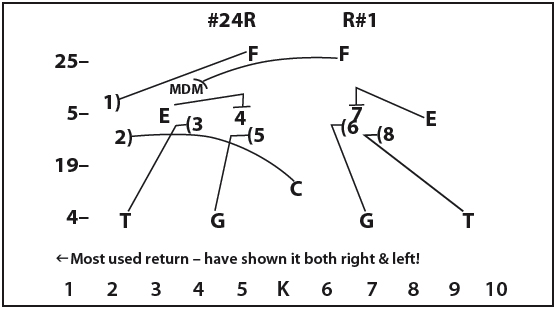
Diagram 6: Scouting – Kickoff Return Team
1. Returners
A. Speed
B. Acceleration
C. Running ability
2. Key Observations
3. System Analysis
4. Alerts
5. Vulnerable to onside
6. Team stats
OPPONENT’S EXTRA POINT/
FIELD GOAL BLOCK TEAM
Diagram 7 shows the form used. In the top portion, we will draw in our extra point/field goal team and then how we expect them to line up for the block.
Key points of emphasis –
• Do they use certain players as their main blockers?
• Where are the designated blockers aligned?
• Are they vulnerable to a fake?
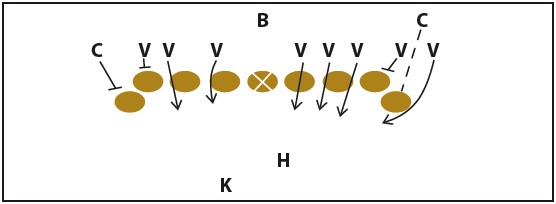
Diagram 7: Scouting – Field Goal/Extra Point Block Team
1.Block scheme
2.Coverage scheme
3. Blockers – number. and gap
4. Key observations
5. Vulnerable to fake? Where? When? How?
6. What defensive personnel?
OPPONENT’S EXTRA POINT/FIELD GOAL TEAM
Diagram 8 shows the form used. At the top of the form, we will draw in their extra point/field goal formation.
Key points of emphasis -
• Who is the kicker and his jersey number?
• Who is the holder, his jersey number and the position he
plays?
• What is the snap-to-kick time?
• Who is eligible to be a receiver?
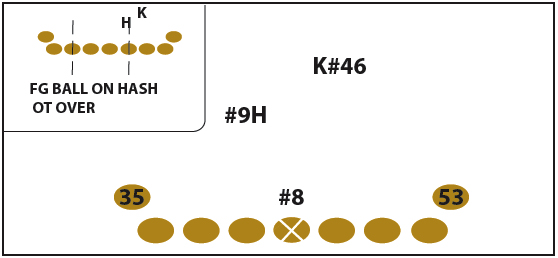
Diagram 8: Scouting – Field Goal/Extra Point Team
1. Protection scheme
2. Strengths
3. Weaknesses
4. Holder
5. Tee placement
6. Snapper
7. Wings eligible?
8. How do we block?
9. Kicker
A. Style
B. Rt/Lt footed
C. Approach
D. Steps
E. Get off time
10. Statistics
A. Field goals
B. P.A.T.
11. Key observations
Just like we break down tendencies for the offensive and defensive scouting reports, the same is done for our special teams.
About the Author: Ron Rankin begins his 14th season this fall on the staff of Millersville University and his second as Defensive Coordinator. From 2008-2010, Rankin was the Defensive Line and Special Teams Coach. He previously was the Head Coach at South Dakota for two seasons. A 1984 graduate of Edinboro, Rankin also coached at his alma mater, Allegheny College, Defiance College, and Gannon College.