One of the biggest areas where there is minimal evaluation transpiring in football from a specific team concept is the kicking game. While it is true that coaches have statistical (quantitative) information on yards per punt, kick return average, field goal distance and other specific indicators regarding the kicking game, there is really nothing that provides a total package. With this new perspective, which is a simple, easy and quick to evaluate the amount of yardage the kicking game is gaining or losing for the team, coaches can make the kicking game special.
Eight years ago a simple chart, originating from bits and pieces from many different sources, was created. In putting the numbers together, a system was designed that enabled the team to understand how it was performing concerning the various kicking teams as a whole. Additionally it provided for individual kicking team statistics that the coaching staff had access to regarding areas of improvement. The chart I included is for the Prairie High School team in 2006 when I was an assistant coach (See Diagram 1 for 2006 summary).
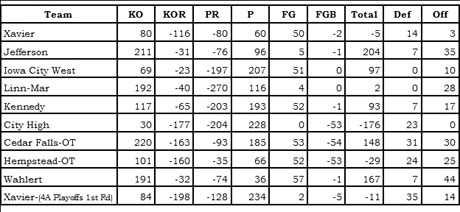 Diagram 1: Special Teams Summary
This is a finished working chart from the 2006 season. Keep in mind that during the season it is being updated and evaluated week-to-week. We post the chart on the bulletin board every Monday so all players and staff members can see our progress. While it is a very easy chart to make, sometimes the conclusions need to be paired with the score of the game. This chart takes about twenty minutes for a coach to produce. With our computer program, via the filtering process of digital game clips, it’s normally completed in about fifteen minutes and ready for presentation to the staff on Sunday. Before the computer became a major tool of our scouting and game preparation, it was done by a position coach in addition to his other duties during film breakdown. It should also be pointed out that we chart each kick that our kicking teams participate in after the game (Diagrams 2-6).
Let’s examine the categories for understanding and then the analysis component should bring it all together concerning the kicking game as an important part of the football team. The following are the definitions of specific labels:
Kickoff: In high school football it is normally kicked from our own forty yard line. When we kick off and the opposing team is able to make a return, every yard they run the ball back comes off our total. As an example, we kick from our -40 to their +5 yard line; the opposition returns the ball to their own twenty or our +20. We have just gained forty yards in field position. Please keep in mind that in a safety situation the ball is being kicked from the opponents twenty or our -20. If you have a game where you score a lot of touchdowns, this number could be giving a false impression as to how the kickoff team is doing. This is one of the reasons why we chart each kick (See Diagram 2).
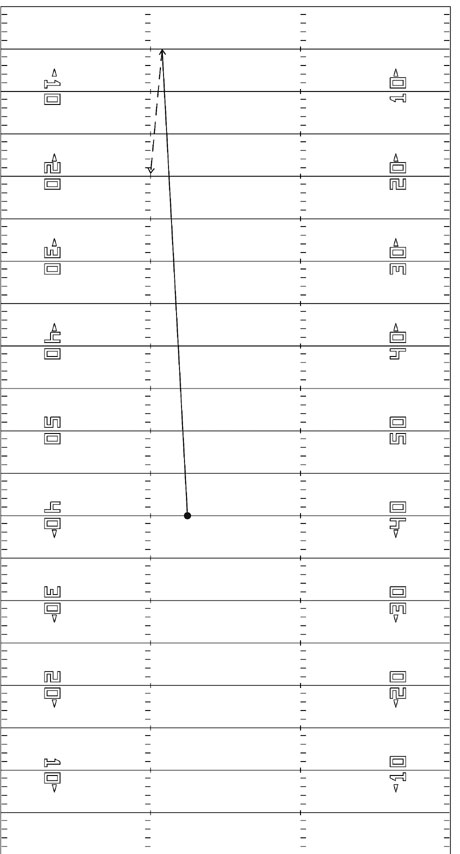 Diagram 2: Kickoff Results
Kick Return: An example is that the opposing kick team is starting on our +40 yard line, kicks to our three (-3). If we return the ball to the -44, we had a loss on the play of -16 yards (See Diagram 3).
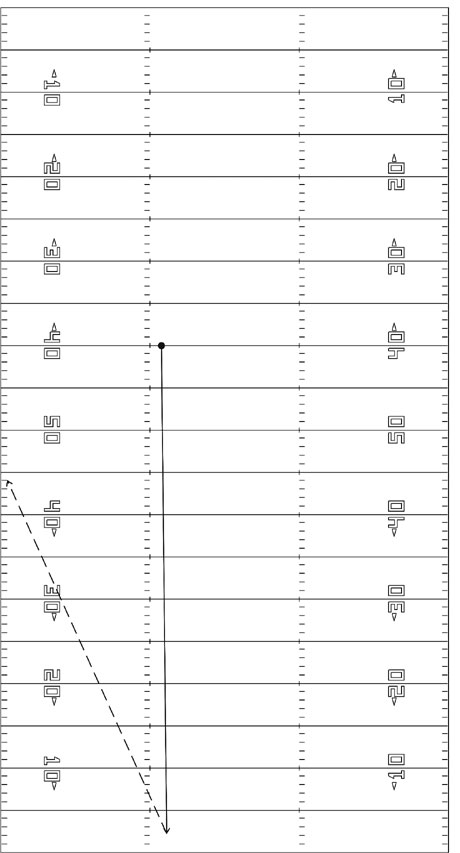 Diagram 3: Kick Return Results
Punt Return: An example of this is that the ball is on our +25 yard line and the opposing team punts the ball to us. We catch the ball on the -35. If there is a fair catch with no return we have just lost forty yards in field position. If on the play there is a return of 22 yards, we have then limited the loss in yardage from negative 40 yards to a net negative of 18 yards. If we block a punt, we are given the yardage gained from the play. Obviously you cannot chart the huge psychological advantage that is not statistically driven throughout the rest of the game. But a blocked punt does have a direct quantitative place within the framework of the game (See Diagram 4).
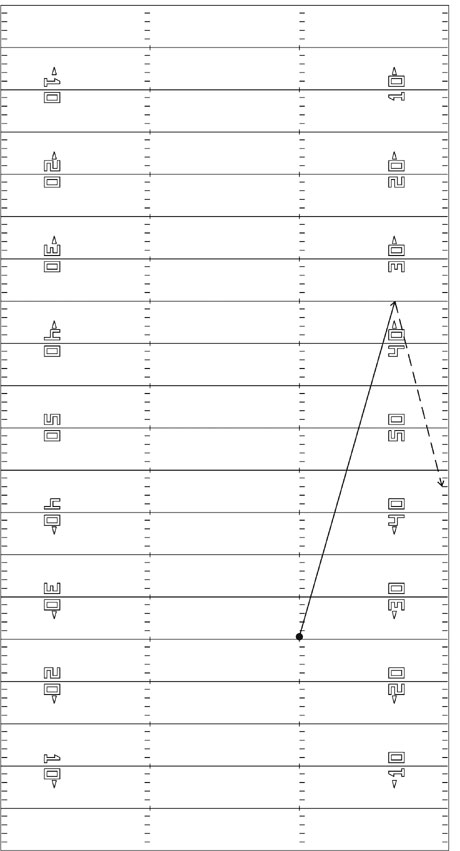 Diagram 4: Punt Return Results
Punt: An example of this is if the line of scrimmage is the -45 yard line. We punt the ball to the +3 of the opposing team where they catch it and return it to our +22 yard line. The result is our team gaining 33 yards. If our punt is blocked the yardage is lost on the play. Again, there is a huge psychological advantage that is not statistically driven throughout the rest of the game but does have a direct quantitative place within the framework of the contest (See Diagram 5).
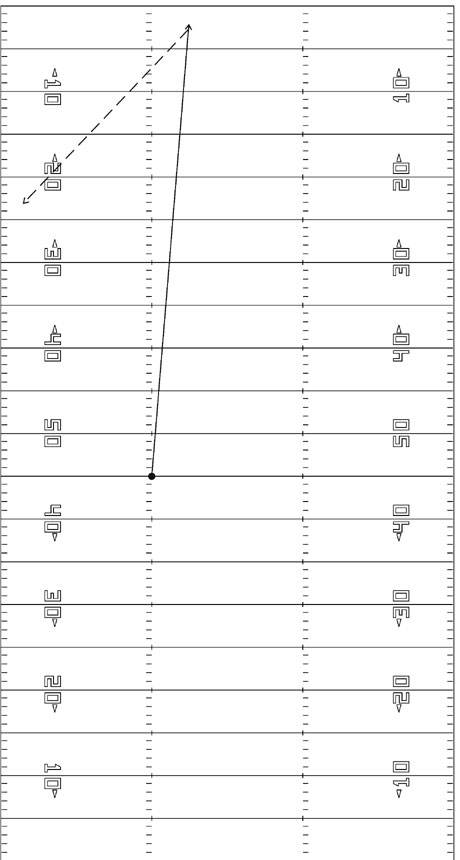 Diagram 5: Punt Results
Field Goal: Field goals and field goals blocked were originally sticking points in the fair evaluation and calibration of yards gained or lost through the kicking game. What was concluded, by watching many hours of video, was that normally in high school football a field goal that was made forced the opposing team into the necessity of another possession set at 50 yards.
If we made a field goal then we would get fifty yards. An example: the field goal team successfully kicked a field goal from the +5 yard line; thus, the field goal column would be given 50 yards. If the field goal was blocked, the location of the recovery would determine the slide in a positive or negative setting with specific yardage for us. Please remember in high school football if the ball does not pass the goal line, it is live and can be returned by the defense. If the kick is an extra point and it is made it is only worth one point. If the kick is missed then no point is awarded in our column entitled FG (See Diagram 6).
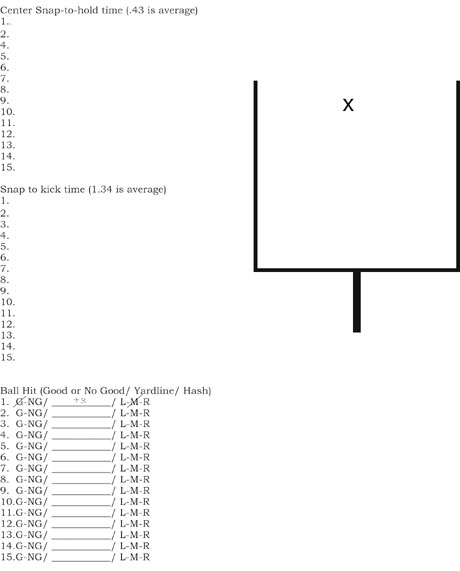 Diagram 6: Field Goal Chart
Field Goal Block: The same criteria is used for our field goal block team as for the field goal team. If the opposing team kicks a field goal successfully then they get fifty yards or it would be a -50 in the field goal block column. No matter what the distance is of the field goal it still counts as -50 due to the fact that another possession is required by our team to score. Note: if we score a safety on defense we put those two points under the field goal block area since the number will probably stick out to the players more in that column.
Total: This is the column that is normally the most telling in the amount of yardage the kicking teams have gained or lost in a given game. To obtain the total amount add the positive numbers together; these are normally kickoff, punt and field goal. A working example from the Linn-Mar game is shown in Diagram 7. The kickoff team had a +192; the punt team had +116; and the field goal team had a +2 for a total positive yardage of 312 yards. The kick return team had a -40; the punt return team had -270; and the field goal block team had a 0 for a total negative yardage of 310. Take -310 yards from 312 and we gained two yards in field position through our kicking teams.
 Diagram 7: Special Teams Analysis
The analysis aspect of this system is the most important concept when evaluating this chart. In both victory and defeat, coaches draw specific conclusions based on snapshots of plays that stick in their minds. While this snapshot picture is accurate, it does not always ‘snap’ the entire picture of what transpired in the game or for that matter sometimes the season. This simple chart forces the coach to slow down and examine what is going on with specific special teams and special teams as a whole.
The Linn-Mar game is such an example. We scored four touchdowns, which means we kicked off five times for a total of 192 gained yards. Numerically, this is not where we want to be, considering that Linn-Mar started two drives over their own 30 yard line. Our kickoff number should be higher based on the results of this game. This would be an area of discussion in our meetings regarding personnel and/or specific trends playing out since this was game four of the season. Our kick return team only had the ball kicked to them once for a -40 total. Based on the game, our offense started that drive on our own 20 yard line (not the goal for our kickoff team).
The punt return number is high from a negative perspective – 270 yards in which Linn-Mar put us in difficult situations. There is good news and bad news to this number. The good news is that our defense stopped them and they were forced to punt a multiple number of times. The bad news is their punt team did an excellent job and our punt returners did not catch the ball on the fly. Many punts went in favor of Linn-Mar. This -270 number was with a blocked punt for a touchdown by the punt return team in the third quarter.
The punt team did a good job of covering punts. Some times the punt number will not be high if the punter nails one inside the opposing team’s 20 yard line or is punting from a short field such as on the +35 yard line. A good punt team is not always reflected by its total yardage. A couple of reasons why a coach does not want to see a very high number is that the offense is not moving the ball; therefore, there’s more punting in the game. And the punter can go for distance which means you are starting many of your drives in negative territory and not getting out of that area. From an analytical standpoint a coach would want to look at the average of the punter with respect to the ball location on the field and what is being asked of the punter.
The field goal team in the Linn-Mar game was four for four in kicking extra points. An excellent night for them and the field goal block team was not challenged.
The key number in the total column in which the special teams are evaluated as a whole was a +2. After the final possessions by both teams, the special teams were not very special in winning the game for us. Analyzing it a different way would be that they did their job, we blocked a punt and had no blocks against us. We did what the special teams were supposed to do at the end of the contest. This game was won somewhere on the offensive and/or defensive side of the ball with the help of the kicking game. It played an important supporting role.
Year Analysis
Looking closely at the season chart (Diagram 1), the Kennedy game was a contest in which we outgained the opponent by 93 yards. It was a close contest the entire way with field position important to the outcome of the game. This was a game where we pointed to our three teams (offense, defense, and special teams) in terms of execution. It paid off in a win over a formidable opponent. Our special teams gained almost 100 yards in field position throughout the course of the game. The kicking game not only played a supporting role in all areas, it helped make a difference in winning vs. losing.
Examining the punt return column, you will see we were giving huge chunks of field position to the opposition (week 3 through week 6). We determined through this chart, and anecdotal evaluation, that we needed to make a change in personnel to limit the damage that was being inflicted on our offense in the category of field position. After the change in personnel, the numbers changed dramatically for us as can be seen in the chart (week 7 through week 9).
To show the trend in the years 2003 through 2006, we compiled a winning percentage of 87% when the special teams total is 0 to plus yardage. When we are zero to negative in total yardage we have only won 39% of the time. Additionally, anything over 100 yards in special teams total, we win 100% of the time. This proves to be a good indicator of the need for quality special teams in a football program.
In conclusion, while the special teams chart is simple and easy to fill out for a coach, the chart is also necessary to analyze and evaluate what is going on in a specific game or games that could be directly affecting the offense and defense. Additionally, this simplistic system sends a quantitative reminder, whether that be plus or minus, to players that what is happening on special teams does get evaluated by the coaching staff and does make a difference for team success.
Jim Dostal just completed his first year as an assistant coach at Coe College. He had been an assistant coach at Prairie HS in Cedar Rapids (IA) and is a 21 year coaching veteran. He can be reached at jimdostal@hotmail.com.